When it comes to AI adoption by industry, four US sectors are well ahead of the rest. Businesses in the information sector have the highest AI use rate at 39.7%, followed by professional, scientific, and technical services (37.0%), educational services (34.7%), and finance and insurance (33.9%). The national rate across all US businesses is 19.8%.
If you’re asking whether your company is behind, start with that 19.8%. It’s the closest thing to a national benchmark, and it’s lower than most headlines suggest. Your sector’s rate shows where your field stands. Where your own company stands takes a different measure.
Search for an AI adoption rate and you’ll find figures for the same year ranging from under 20% to nearly 90%. Both ends are accurate. They come from surveys of very different companies, asking very different questions.
This guide explains why the numbers disagree, gives you the sector picture, and covers what predicts results once you look past the sector line.
Why published AI adoption rates disagree with each other
In 2026, one survey found that 19.8% of US businesses were using AI. Another found nearly nine in ten respondents’ organizations using it regularly. If you quote the first, AI looks like something most companies haven’t started. If you quote the second, any company that hasn’t started looks late. The gap between the two comes down to who each survey asked and what each one counted as using AI.
They survey different companies.
The Census Bureau’s Business Trends and Outlook Survey covers US employer businesses of every size, from a five-person shop to a multinational, and counts each business once. Most US businesses are small, so small firms shape the result. On that basis, 19.8% currently use AI.
McKinsey’s The State of AI 2026 surveyed 1,719 people at organizations in 97 countries, and 36% of them work at companies with more than $1 billion in annual revenue. Nearly nine in ten respondents report regular AI use in at least one business function.
Both figures are correct about different populations. The Census Bureau’s own data shows larger firms use AI more, so a survey with a heavy share of large organizations will report a higher rate.
They ask different questions.
The Census Bureau used to ask whether businesses used AI “in producing goods or services.” In November 2025, it changed the question to AI used “in any business function.” The new wording counts a business that uses AI to draft emails. The old wording was meant to leave that out. A Census figure from before the change measures something narrower than one after it, so the two don’t line up as a trend.
"Adoption" means several things.
Any use, regular use, enterprise-wide scaling and production deployment are four different measures, and each one produces a different number. McKinsey’s survey shows how far apart they sit, even inside one dataset. Nearly nine in ten respondents say their organization uses AI regularly somewhere. Just 44% say it’s scaling across the enterprise, and 37% attribute any EBIT impact to it.
The same applies to adoption of AI by industry. A sector rate from the Census Bureau and a sector rate from an enterprise survey describe different groups of companies, even when the sector name is the same.
Before you repeat an adoption figure in a board deck or a budget request, check two things: who was surveyed and what counted as adoption. Answer both, and most of the contradictions in this data stop being contradictions.
AI adoption rates by industry
The Census Bureau measures AI use across US sectors every two weeks, which makes its survey the most complete public record of adoption of AI by industry. Its sector figures for the two weeks ending May 3, 2026, show a wide spread. Businesses in the leading sector use AI at more than five times the rate of businesses in transportation and warehousing.
Each current-use rate below is the share of businesses in that sector that used AI in any business function in the previous two weeks. Expected use is the share that plans to use it within six months.
The Census Bureau found no significant change in either the information or the finance and insurance rate between December 2025 and May 2026, and the same held for their expected use.
What the top and bottom have in common
Information businesses, such as publishers, software companies, broadcasters and telecom providers, sell information as their main product. Finance and insurance run on documents, data and analysis. In both, most of the work happens on a screen and in the formats AI tools handle best: text, numbers and code.
Retail sits near the bottom. Much of its work involves moving physical goods and serving customers in person, which gives AI fewer obvious places to fit.
Heavy regulation hasn’t kept finance and insurance from ranking second, which suggests a sector’s rules say less about its adoption rate than the kind of work its people do.
If your sector sits near the bottom, AI use in your company will likely start in desk-based roles, where learning how to use AI at work looks much the same as it does in an information business.
What industries benefit most from AI adoption?
The biggest gains go to industries whose core work is high-volume, screen-based and quick to check, such as software, media, financial services and the marketing side of consumer goods and retail.
That list overlaps with the adoption table, but it isn’t the same thing. The Census Bureau measures which businesses use AI. Which industries benefit most from AI adoption is a separate question, and no major survey publishes it by industry.
McKinsey’s The State of AI 2026 reports EBIT impact across all respondents at 37%. What it does break out is where the gains show up. Respondents most often report cost reductions from AI in supply chain management, service operations and manufacturing. Revenue gains come most often from marketing and sales, followed by product development and software engineering.
That’s why the two lists can differ. Manufacturing isn’t among the Census leaders, yet supply chain and manufacturing are where respondents most often report cost savings. Retail sits near the bottom of the Census table, and marketing and sales, where retail respondents most often use AI agents, is the top source of revenue gains.
What makes an industry a good fit
Three conditions decide how much an industry gains:
- A high volume of repetitive knowledge work. The more often a task repeats, the more each improvement adds up.
- Output that’s text, code or data. AI produces these directly, so the gain shows up in the work itself.
- A short feedback loop. When someone can tell quickly whether the output was any good, teams learn what works and fix what doesn’t.
Industries that meet all three gain the most and the fastest. Where the work is physical, or where a wrong answer is expensive, the gains still come, but more slowly, even with heavy investment. Finance and insurance show the second case. It ranks second for AI use, yet much of its work needs careful review before an AI output can be trusted.
Where each industry is putting AI to work
McKinsey’s survey shows industries using AI agents in their core functions. Technology respondents most often use agents in software engineering. Consumer goods and retail respondents most often use them in marketing and sales. Advanced manufacturers, such as automotive, aerospace and semiconductor companies, use them in the supply chain, inventory management and the manufacturing process.
Each of those functions appears on McKinsey’s list of where cost or revenue gains are most often reported. In each case, the industry is pointing AI at the work its business runs on.
Company size is where AI adoption is moving
Most coverage of AI adoption by industry stops at the sector line. Census data shows company size moving the numbers in ways a sector average can’t capture, and it’s the clearer signal of where AI use is rising.
In the two weeks ending May 3, 2026, 37% of firms with 250 or more employees used AI, and so did 32% of firms with 100 to 249. Among firms with four or fewer employees, the rate was under 20%. Between December 2025 and May 2026, use rose among firms with at least 20 employees and showed no significant change among smaller ones. Over the same months, neither leading sector, information, nor finance and insurance, changed significantly.
Size also splits the picture inside a sector. A Census working paper covering November 2025 to January 2026 found AI use reaching 50% to 60% among very large firms in information, professional services and finance. In the May figures, the information sector as a whole sat at 39.7%.
McKinsey’s The State of AI 2026 shows the gap widening past first use. Among organizations with at least $1 billion in revenue, 54% report AI scaling across the enterprise, against a third of smaller organizations. The share of large organizations scaling AI agents rose from 27% to 40% in a year, while smaller organizations stayed at 22%.
For a mid-sized company, this changes what a sector average means. That average blends five-person firms with multinationals, and small firms make up most of the count. A 300-person retailer comparing itself with retail’s 14% is measuring against a number shaped mostly by businesses a fraction of its size. Firms of its own size, at 32% to 37% nationally, are the closer comparison.
The size gap also compounds. Because large organizations are scaling faster, the head start on building an AI workforce keeps growing for the companies that already have one.
Individual gains are real. Company gains are rare.
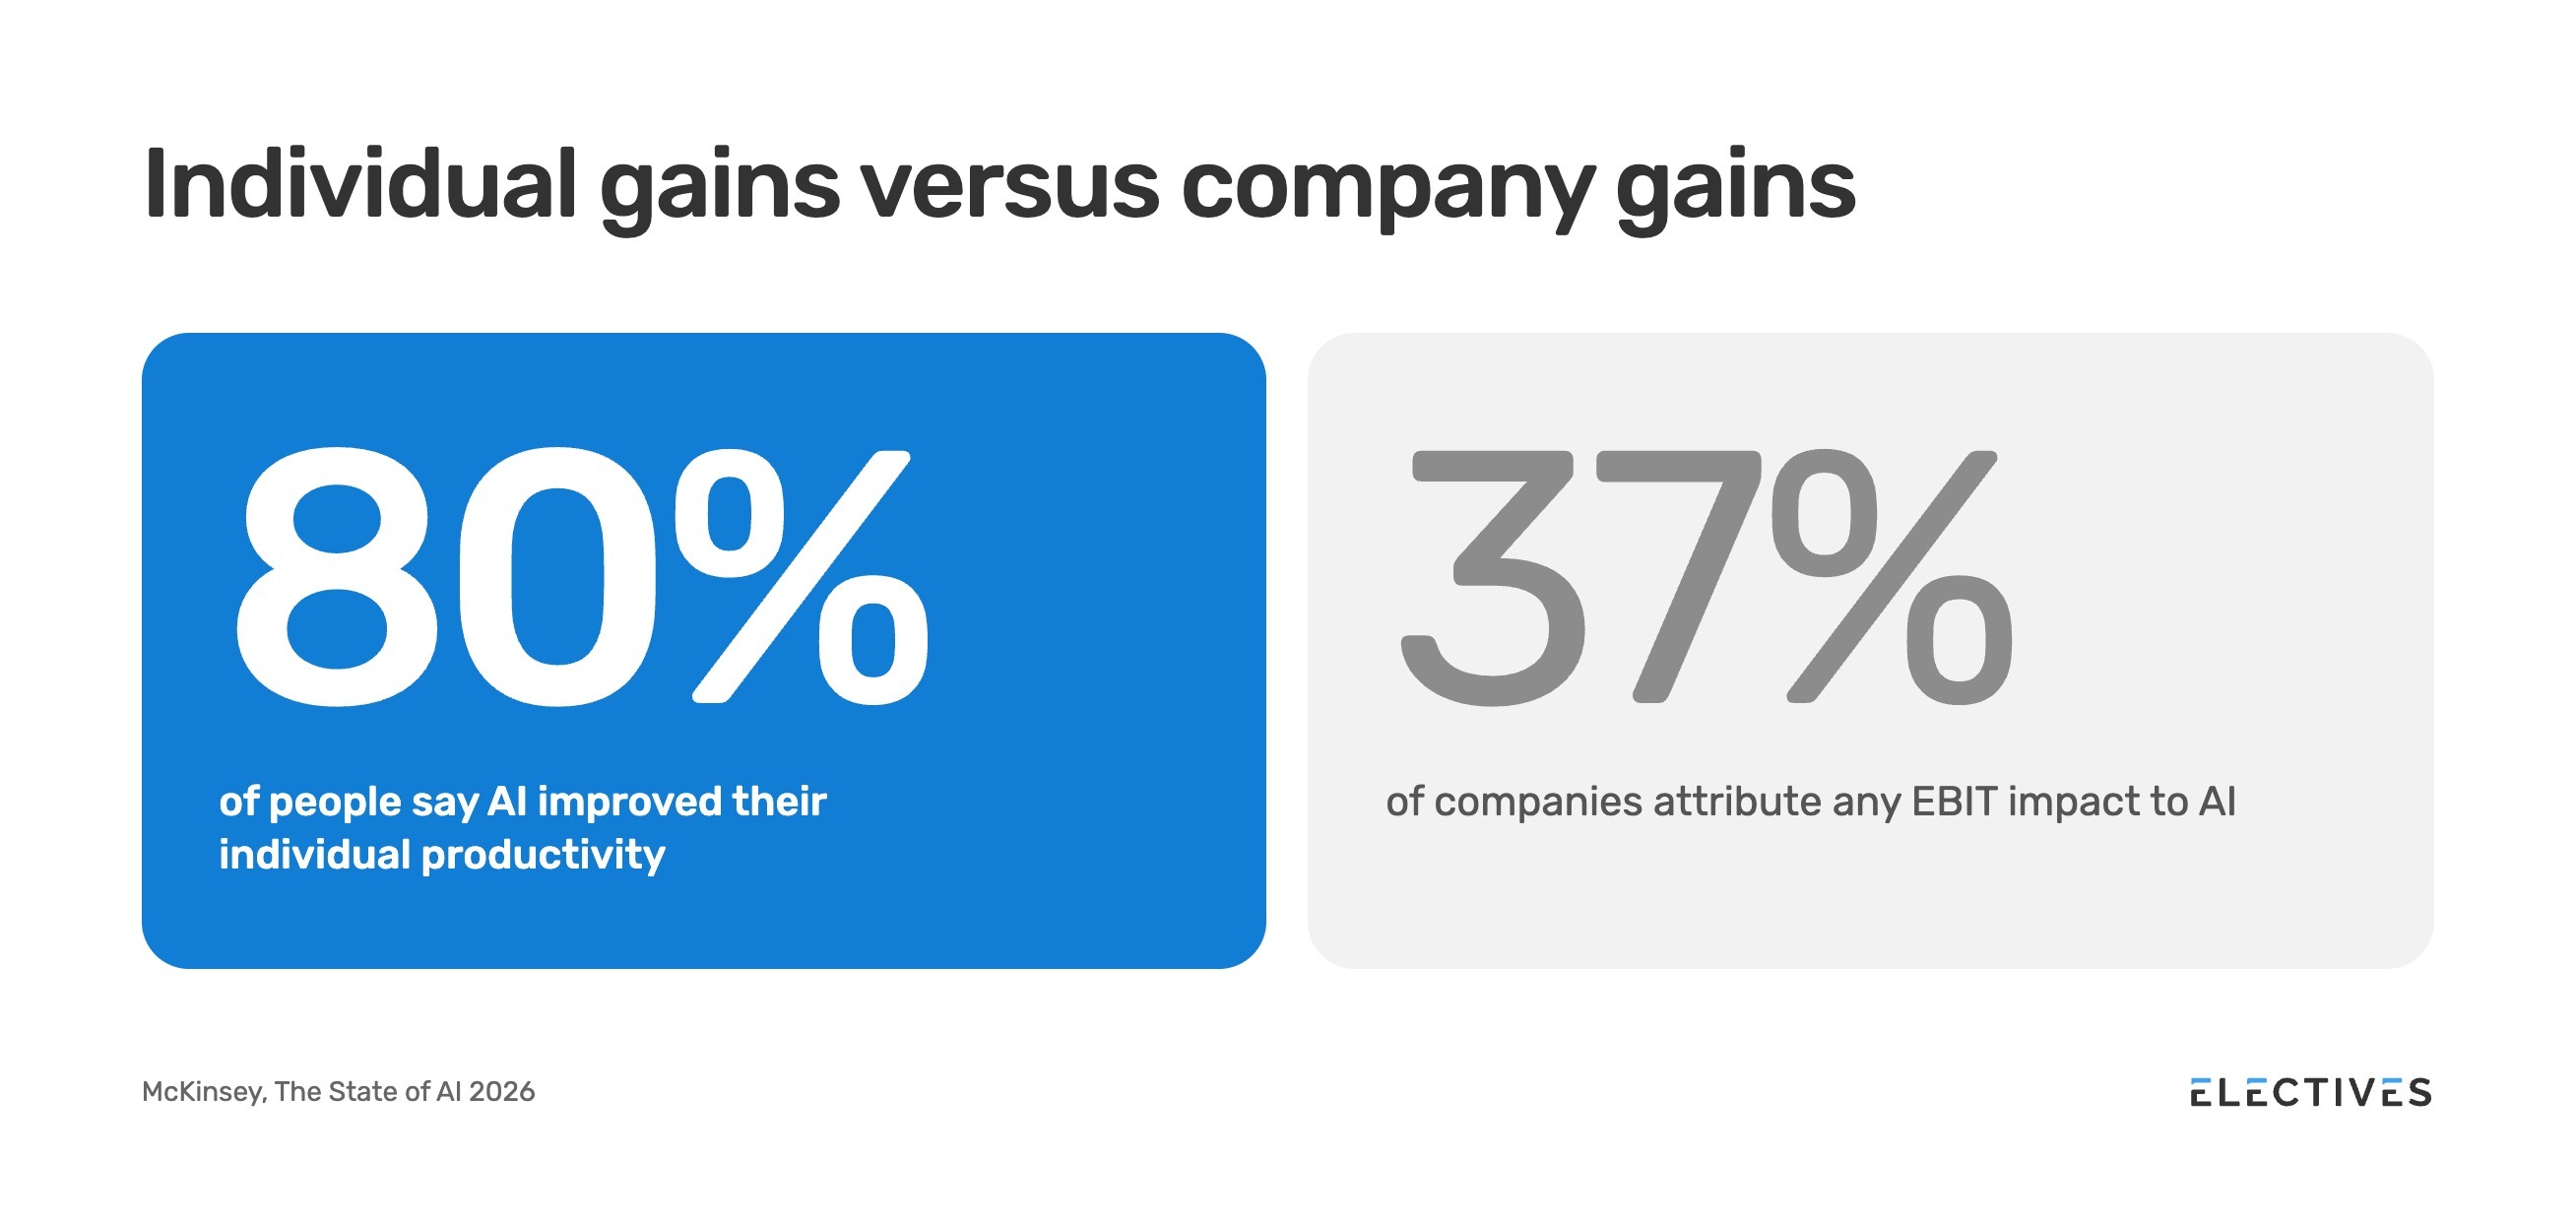
Eighty percent of respondents to McKinsey’s The State of AI 2026 say AI has improved their individual productivity, and 50% say it helps them make better decisions. At the company level, 37% say AI has contributed to their organization’s EBIT. About 6% attribute at least 5% of EBIT to AI and describe the impact as significant. McKinsey calls the gap between individual gains and enterprise impact one of the survey’s striking findings.
The two numbers measure different things, one a person’s own work and the other a company’s results, and that difference is the story. People are getting faster at their own tasks. Most of that speed never reaches the organization’s results. Somewhere between one person working better and a company performing better, the gain gets lost.
Picture a sales rep who now drafts proposals in a fraction of the time. That time goes somewhere: more proposals, earlier finishes, a longer lunch. Unless the team changes its targets, handoffs or review process to put the time to use, the company’s numbers look the same as before.
Most companies already have access. Nearly nine in ten respondents report regular AI use in at least one business function, and 44% say AI is scaling across their enterprise. Turning individual use into company results is where most organizations stall.
The skills are forming too. McKinsey reports that employees are building AI fluency on their own or with help from company rollouts of general-purpose AI tools, and it describes this as the human foundation now available to close the gap. In most of these companies, the capability already exists. It’s spread across individuals who each worked out their own approach, with little of it shared or built into how teams work.
McKinsey’s analysis of the 6% sorts companies by performance, and the traits that separate them describe how a company runs. Nearly three-quarters of high performers have fundamentally redesigned workflows because of their AI use, against one-quarter of other respondents. High performers are also twice as likely to say their senior leaders show commitment to AI initiatives and twice as likely to have defined processes for measuring impact. None of these traits depend on what sector a company is in.
The managers in the middle are carrying this
The people who asked to change how work gets done are having the hardest time with AI. In McKinsey’s The State of AI 2026, 47% of mid-level managers and individual contributors report at least one negative effect from AI use, compared with 31% of executives and senior managers.
McKinsey counts managers and individual contributors together, so that figure covers more than managers. The manager layer is still where it matters most. Executives set direction, and individual contributors do the work. Managers decide what happens in between, including whether AI use becomes normal on a team or fades out after the first few weeks. A manager who’s had a bad experience with AI, or who can’t answer a team member’s question about what’s allowed, passes that hesitation to everyone who reports to them.
This is where the gap between individual and company AI gains opens. When one person on a team gets faster, that’s a personal win. When a manager sees what that person changed and gets the rest of the team working the same way, the gain starts to affect the company’s results. Without someone in the middle who’s equipped to do that, individual gains stay individual.
The order of training follows from this. AI training for employees that reaches individual contributors before their managers produces more of what the data already shows: people getting faster on their own, with little of it adding up. Managers who go first can show their teams what good use looks like, answer questions as they come up and change team routines so the time saved goes somewhere.
What to do with your industry's number
Your sector’s AI adoption rate is useful for some jobs and misleading for others. Three rules keep it in the right place.
- Use it to understand your field and build a budget case. A sector rate shows how widely companies like yours use AI, and it gives your finance team an outside reference point when you ask for investment.
- Don’t use it as a performance benchmark. A sector rate averages companies of every size and capability level, from five-person firms to multinationals. If you compare at all, compare with firms of your own size.
- Check the source before it goes in a board deck. Find out who was surveyed and what counted as adoption. A Census rate and an enterprise survey rate can describe very different groups of companies, even under the same sector name.
Measure your own baseline instead
The comparison that tells you the most is your company against itself. Measure where you’re starting, then track how it changes.
A useful baseline covers three things:
- What people use AI for today, and how often.
- What they avoid using it for, and why.
- Whether they know what’s permitted under company policy.
The answers often differ from what leadership expects. A team assumed to be leading may be using AI only to tidy up emails. A team that looks cautious may be holding back because nobody told them what’s allowed. An AI fluency assessment gives you this picture team by team, so you can see where skills already exist and which managers need support first.
Once you have a baseline, track the number that connects to company results: how much of the productivity people already report is showing up in their team’s output. If that share is rising, AI is starting to reach the business.
Where to start
Your sector’s number shows how widely AI is used in your field. Whether it works in your company depends on what your own teams do with it.
Electives™ helps with that second part. If you’re comparing the best AI solutions for corporate training, here’s how we work. We run live classes led by vetted experts, and we start with managers, since they shape how their teams work. Managers learn to see what’s working and share it, and their teams practice it in their daily work. We measure success by how people’s behavior changes on the job: 92% of learners change their behavior.